Ultimate Guide to Data Warehouses
Data warehouses are an important part of a business.
As a developer, you'll be involved in the data warehouse in one way or another: creating it, designing it, accessing it, or working on software that provides data to it.
Learn all about data warehouses in this guide.

What Is a Data Warehouse?
A data warehouse is a type of database that's designed for reporting and analysis of a company's data. It collects data from one or many sources, restructures it in a specific way, and allows business users to analyse and visualise the data.
Why Do We Need a Data Warehouse?
You've probably heard of databases that are used for storing data for applications or websites. These databases specialise in recording transactional data: things that happen during the operation of a business. Some examples are:
- Hotel reservations
- Airline bookings
- Student course enrolments
- Posts on a forum
- Sign-ups and sales on an eCommerce website
If we have these databases, why do we need a data warehouse?
Why don't we just run analytics on the normal database?
The main reason is performance.
These transactional databases (the ones that store the data for business operations) are often changing regularly. New data is added every second (depending on the size of the application and who is accessing it).
The design of the database is optimised for regular changes: INSERTs and UPDATEs. The design is often normalized to avoid redundant data and to improve data integrity.
These databases are not often optimised for SELECT statements (viewing data). They allow data to be viewed, but the design is not focused on selecting a lot of data in a short amount of time.
A data warehouse is designed in a different way. The design is made to optimise the performance of SELECT queries across more data. The INSERTs and UPDATEs happen rarely (often overnight as a big batch) and the SELECT statements happen all the time. This means it performs better when viewing data.
Also, the performance of a database in a live system is important. Businesses want their websites and applications to be fast, and so do customers. If your database is allowing customers and users to place orders or enrol or create forum posts (or whatever it is designed to do), allowing business users to generate reports on this data at the same time will put extra load on the database and slow everyone down.
Having a separate database allows the normal transaction database to perform well and the analysis of data to be done without impacting it.
So, the two main reasons to use a data warehouse are performance-related:
- Allow business users to analyse data quickly using a specialised database design
- Prevent the main transactional database from slowing down due to data analysis
Data Warehouse vs Database (OLAP vs OLTP)
There are many differences between a traditional database that you might use for a website or application and a data warehouse.
Two terms you might see when referring to these databases are OLAP and OLTP.
OLAP stands for OnLine Analytical Processing, and represents databases that work like a data warehouse: focused on analysis instead of inserts and updates.
OLTP stands for OnLine Transaction Processing, and represents databases used for transactional data (inserts and updates), such as websites and applications.
The differences between OLAP and OLTP, or regular databases and data warehouses, can be summarised by this table:
| Criteria | OLTP/Regular Database | OLAP/Data Warehouse |
|---|---|---|
| Purpose | Record transactions from a system | Analyse data from one or more systems |
| Design Focus | Optimised for fast INSERT and UPDATE | Optimised for fast SELECT |
| Table rows and columns | Many tables, fewer columns, fewer rows | Fewer tables, many columns, many rows |
| Table design | Usually normalised | Fact and Dimension (or a variation of) |
| Data source | Usually from a single application | From one or many other databases |
| Populated By | Regularly when users interact with the system | Usually with a batch process or set of scripts |
| Concurrent Users | A large amount | A small amount |
What does each of these points mean?
Purpose
As I've mentioned above, the purpose of a database is to store transactional data from a system, such as an application or a website. The purpose of a data warehouse is to allow people to analyse the data from one or more systems.
Design Focus
The focus of the design of a database is to be optimised for regular and fast INSERT and UPDATE statements, so data is changed easily and the users don't experience a delay when using the system. The focus of a data warehouse design is for fast SELECT statements, to allow data to be viewed quickly.
Table Rows and Columns
In a regular database, there are often many tables compared to a data warehouse. These tables have fewer columns and rows (they still may have a lot, just less compared to a data warehouse).
Data warehouses, on the other hand, have a smaller number of tables, but these tables often have more columns and rows in them.
Table Design
The design and relationships of the tables in a regular database are usually normalised. This means they follow a standard set of rules for what they represent and how they are related, to ensure data integrity and reduce repetition.
In a data warehouse, the tables are often designed using a "fact and dimension" structure. This means there are one or more tables that store transaction records, and many tables that store data about the transactions.
I'll go into more about this later in this guide.
Data Source
Regular databases usually have only one system that populates the data. This could be a website or an application or something else. Data warehouses can be populated from one system, but are often populated from many systems in a company. This is because companies often have many systems that each focus on one area of their business, and an enterprise-wide data warehouse that aggregates them all together.
Populated By
Regular databases are populated by the use of the related application. Records are added, updated, and possibly deleted as the system is used. Data warehouses are often populated using custom-built scripts that extract data from these systems and add the data to the data warehouse.
Concurrent Users
A regular database needs to support a large number of concurrent users. This could be hundreds if it's an internal company application. It could be thousands or even millions if it's an external-facing website.
A data warehouse, on the other hand, only needs to support a select number of users. This is usually a small number, depending on the company, and limited to those who make use of the data in the data warehouse.
Creating a Data Warehouse
We've talked about what a data warehouse is and how it's different to a regular database. I've also written about creating a database, which starts with the design.
But how do you create and populate one?
Design the Data Warehouse
The first step is to design the data warehouse. There are several types of designs you can follow, which I'll cover shortly. The process works in a similar way to creating a regular database, and at a high level, the steps are:
- Determine the purpose of the data warehouse
- Determine what systems the data comes from
- Design a table for your facts - the numerical measurements that are being reported on
- Design tables for your dimensions - the attributes of these facts or measurements
There's a lot that goes into these steps, and I'll cover some of it later in this article. At the end of the design steps, you should have a diagram or a structure of how your tables will look.
Populate the Data Warehouse
Now you've got your design, how do you add the data?
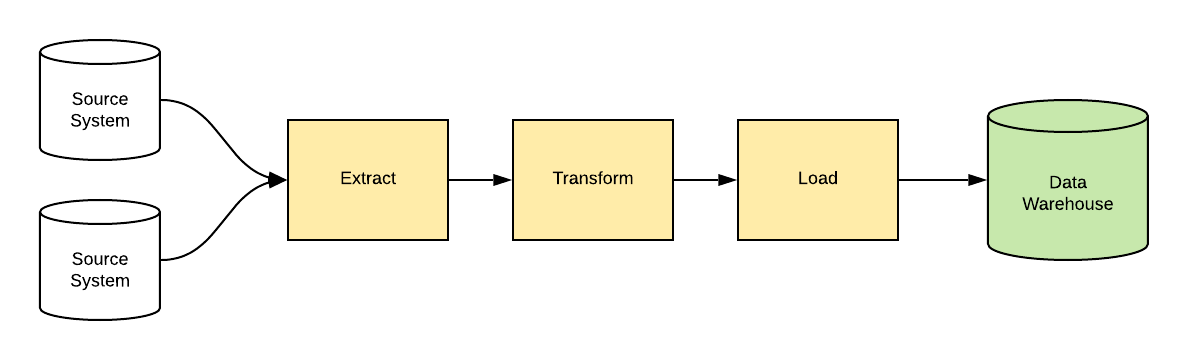
Getting the data into the data warehouse involves three steps: Extract, Transform, and Load (or ETL for short).
- Extract: get the data from the system that captures it (the source system).
- Transform: make adjustments to the data to fit your data warehouse (formatting dates, looking up other tables, etc).
- Load: add the data to your data warehouse tables
This can also be done as ELT, or Extract Load Transform, which means the transformation of data is done after it is loaded.
These steps are often done using a set of SQL scripts, or a tool that's purpose-built for performing this process. Whether you use scripts or a tool, they need to be created manually, and this process can take some time due to the analysis and development involved.
Reporting and Business Intelligence
Once the data is loaded into the data warehouse tables, it needs to be made available to other people in the company.
While you and I might be familiar with SQL and able to run queries on the database, the majority of people who want to see this data will not know SQL.
So, how do we show the data to them?
We can create reports on this data.
The ability to create reports on this data is called Business Intelligence. There are many tools that allow you to create reports on data warehouses. These tools will allow business users to:
- View reports you have created
- Maybe create their own reports
- Filter report data based on criteria (e.g. date range or region or category)
- Display data in charts (bar charts, pie charts, and much more)
- Display data summarised in tables
The development team often creates these reports in specialised tools that the business users can access. Some tools also allow business users to create their own reports, saving everyone time.
Data Warehouse Designs
We've mentioned the designs of data warehouse briefly in this article, and that they are different to regular databases.
While regular databases usually follow a process of normalisation to get to an ideal design, data warehouses have several different design approaches you can follow.
What are they?
Star Schema
A star schema is a type of data warehouse design. It's called a star schema because it looks like a star. It has a single fact table in the centre, and several dimension tables linked to it.
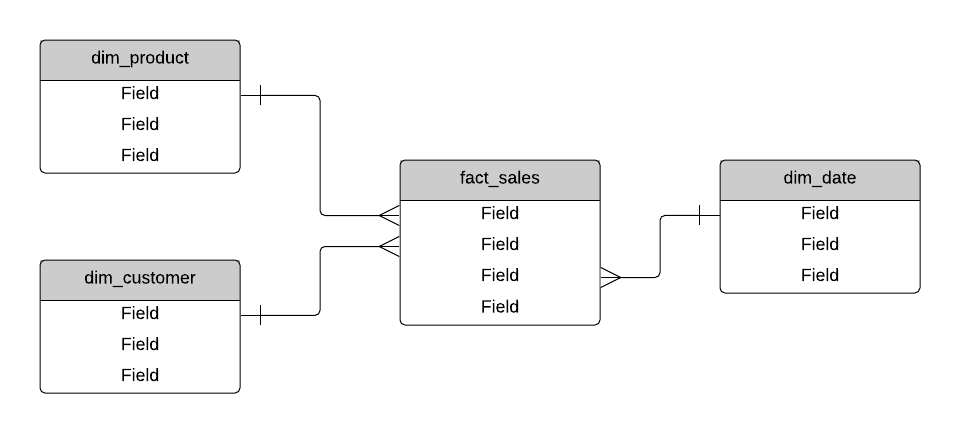
A fact table is a table that stores a row for each value you want to measure. For example, it could be a sale of a product to a customer. Fact tables are usually quite large: they can have millions or billions of rows.
A dimension table is a table that stores reference information about a fact. It can store an entity, such as a customer or product, or it can store a concept such as a date. They are not normalised as they contain a lot of redundant data, but this is OK as it is a deliberate design that helps to speed up SELECT queries.
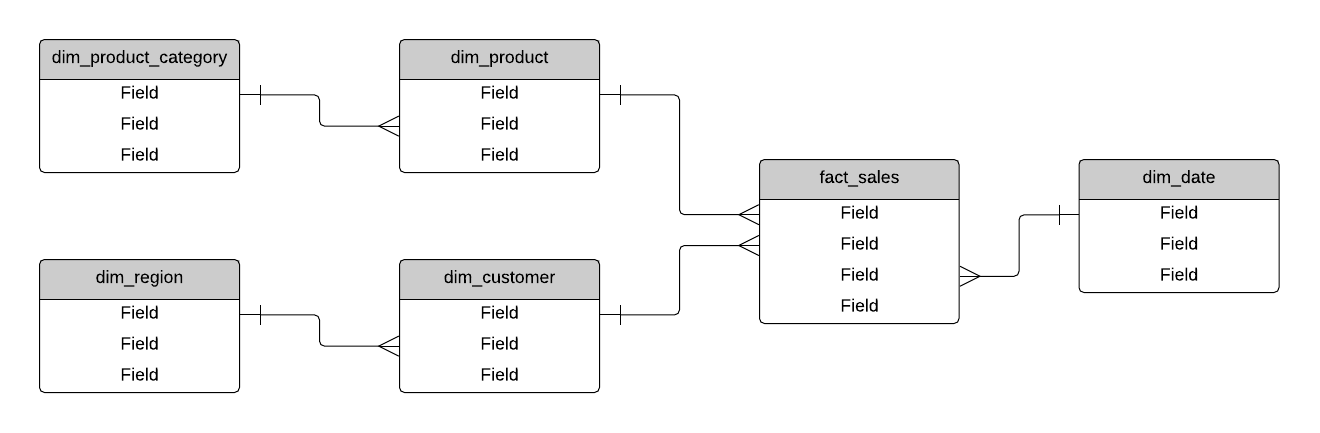
Snowflake Schema
A snowflake schema is a type of data warehouse design that has a single fact table in the centre, several dimension tables linking to the fact, table, and further dimension tables linking to the dimension tables.
It's called a snowflake schema as the design often looks like a snowflake: a large centre with smaller nodes or branches at certain points.
Star Schema vs Snowflake Schema
A star schema and snowflake schema are two of the most popular designs for data warehouses.
What is the difference between a star schema and a snowflake schema?
Let's take a look.
| Criteria | Star Schema | Snowflake Schema |
|---|---|---|
| Fact tables | One | One |
| Dimension tables | Multiple, one table to one dimension | Multiple, one or more tables to one dimension |
| Dimension table relationships | Only to the fact table | To the fact table or other dimensions |
| Data redundancy | Minimal: lots of data is repeated | Minimal, but less than Star Schema due to split of dimensions |
| Queries | Simpler to write as they have less joins | A little harder to write as there are more joins (but not complex) |
Whether you decide to use a star schema or a snowflake schema is up to you and your team. If you're just starting out, I would recommend using a star schema, as the concept of a single dimension is easier to understand.
Kimball and Inmon Methods
You might have heard about or read two different approaches to creating a data warehouse: the "Kimball" method and the "Inmon" method. These methods are not ways to design a database. They are ways to create a data warehouse for a company, or the steps that are followed and the order they are done in.
Kimball Method
The Kimball Method, named after Ralph Kimball, suggests a "bottom-up" approach.
What does that mean?
It means you create a small data warehouse for one area of the business at a time, and eventually integrate several areas into one large data warehouse. This allows one area of the business to get the benefits of a data warehouse sooner, instead of waiting until the entire data warehouse is done before seeing it.
The process generally looks like this:
- Choose one business area (such as Sales)
- Design the data warehouse for this business area (e.g. star schema or snowflake schema)
- Extract, Transform, and Load the data into the data warehouse
- Provide the data warehouse to the business users (e.g. a reporting tool)
- Repeat the above steps using other business areas
- Once all business areas are done, design a data warehouse to combine them all.
- Populate the main data warehouse from the smaller data warehouses
- Provide access to the main data warehouse to business users.
Inmon Method
The Inmon Method, named after Bill Inmon, suggests a "top-down" approach. This means that the requirements are gathered and data warehouse is developed based on the organisation as a whole, instead of individual areas like the Kimball method. It results in a single data warehouse without the smaller data warehouses in between, but it may take longer to see the benefits.
The process generally looks like this:
- Design the data warehouse for the entire business (e.g. star schema or snowflake schema)
- Extract, Transform, and Load the data into the data warehouse
- Provide the data warehouse to the business users (e.g. a reporting tool)
Data Warehouse vs Data Mart
The term "data mart" is one you might hear when working with data warehouses.
What is a data mart?
A data mart is a subset of a data warehouse that applies to a specific business area. It works in a similar way to a data warehouse, and has a design that is specific to the business area it needs to support. A company may have several data marts, one for each area of the business.
So what's the difference between a data warehouse and a data mart?
A data warehouse applies to one or more business areas, often the entire organisation. A data mart applies to only one business area.
Data Warehouse vs Data Lake
A data lake is another term you'll hear when working with data warehouses.
What is a data lake?
A data lake is a large collection of raw data. It has not been transformed or processed for analysis, as there is no requirement for analysis yet. It's just a place to store data and make it available for future analysis.
How is this different from a data warehouse?
While both a data warehouse and data lake store data, the data warehouse has a specific design and is based on requirements. The data lake stores data without a specific design and without an identified need for analysis.
The benefit of using a data lake is that it's easy to access and make changes. The structure is less defined and the data is not processed, so there are less checking and updates to do.
Data Warehouse Concepts
There are many other concepts you might encounter when working with a data warehouse. Here are some that we haven't covered already:
Fact Table
A fact table is a table that stores a row for each value you want to measure. For example, it could be a sale of a product to a customer.
Dimension Table
A dimension table is a table that stores reference information about a fact. It can store an entity, such as a customer or product, or it can store a concept such as a date.
Slowly Changing Dimension
What is a slowly changing dimension?
It's a type of table that captures both current and historical data. This data changes over time and needs to be kept up to date in a data warehouse. One example is a customer record: their contact details or account status is not updated very often but it may change over time. A data warehouse needs to keep a history of these changes.
Conceptual Data Model
The conceptual data model shows the business objects that exist in the system and how they relate to each other.
It defines the entities that exist, which are not necessarily tables. Thinking of tables is too detailed for this type of data model.
Logical Data Model
A logical model is a more detailed version of a conceptual data model. Attributes are added to each entity, and further entities can be added that represent areas to capture data in the system.
Physical Data Model
The physical data model is the most detailed data model in this process. It defines a set of tables and columns and how they relate to each other. It includes primary and foreign keys, as well as the data types for each column.
These diagrams can be created manually in a data modelling tool. They are also often generated by an IDE from an existing database.
Conclusion
Data warehouses are an important part of a business as they allow a business to analyse and report on the data that it captures. The process for creating a data warehouse is where the developers come in, and they follow a specific design and build process to create and populate a data warehouse. Reporting tools are then used to analyse and view the data.