Sample Database: University Rankings (ERD and SQL)
Do you want to practice SQL on something other than the basic default database? Here's a sample ERD and data for a university ranking database.
When you're learning SQL or database design, it's helpful to use other databases as a reference.
Many articles online refer to Oracle's HR database or SQL Server's AdventureWorks database. These can be helpful, but often you're looking for answers that these databases don't help with.
Which is where this post comes in.

This post describes a sample database containing data about universities. It includes:
- An ERD (entity relationship diagram) for the sample university ranking database
- An explanation of the tables and columns
- A download of sample data to create and populate this database
- An example query on the database
Why is this helpful? Firstly, you can understand more about how a university ranking database might work.
Also, you can practice SQL against realistic data and write your own queries, both simple (universities exist in which country) and complex (which universities had the largest ranking change from one year to the next).
So, let's take a look at the database.
Sample University Ranking Database: ERD
The ERD for the university rankings database is shown here:
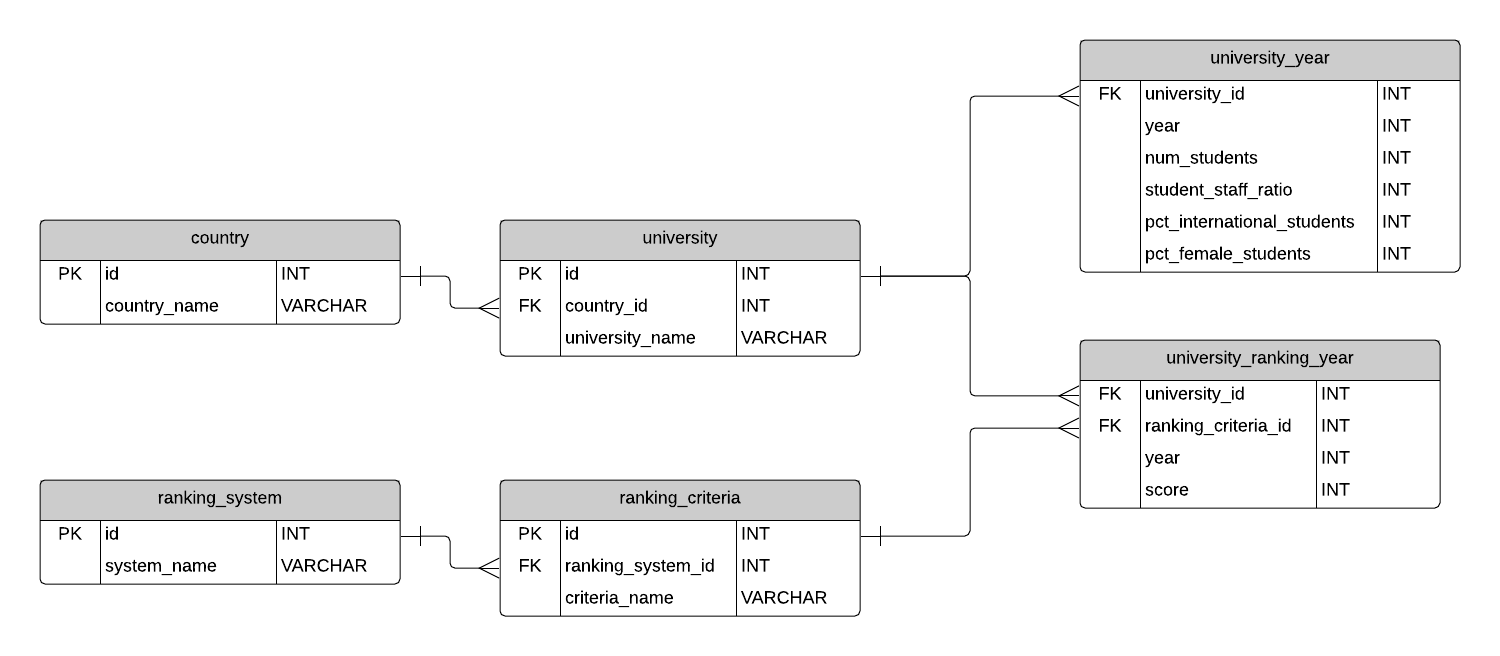
There are a few hundred universities in the sample data, and 21 different ranking criteria across three different systems. The data exists for the years 2005 to 2016.
It doesn't contain every world university, or data up until 2018 or 2019, but it's a good set to work with.
What do all of these tables and columns mean?
Table Explanations
Let's look at what the tables and columns mean.
country
This is a simple list of countries that were in the data set. I don't think it's a complete list of all countries, but it's enough for this data set.
university
A list of universities that were ranked in this system. Each university is related to a country.
ranking_system
This contains the three different ranking systems used: Times Higher Education World University Ranking, Shanghai Ranking, and Center for World University Rankings.
ranking_criteria
This table contains the different criteria used in each ranking system, such as Citations and Quality of Education. It also contains criteria for Total Score for each system.
university_year
The university_year table contains values for measurements such as the number of students and the student to staff ratio for each university in several years.
university_ranking_year
This table contains the score for each year for each university and ranking criteria. It's the largest table in the database.
Design Comments
There are a few things to consider when working with this data:
- Because the data is normalised, you may want to use a PIVOT or subqueries to get scores in a column format, if that's what you prefer.
- The measurements in the univeristy_year table could be moved to the ranking_criteria table, as it seems to be storing similar data. But it's separated as it's not really related to a ranking criteria.
Sample Data
I’ve prepared some sample data for this database. You can use this to create this database on your own computer, explore the tables, and write SQL on it.
The sample data is available for Oracle, SQL Server, MySQL, and Postgres, and is stored on my GitHub repository. Find out how to access it and load the data here: Sample Data for SQL Databases
Sample Query
With the sample data in the database, let's take a look at a sample query. This query shows all of the universities and their total scores from 2015
 1SELECT
 2u.university_name,
 3c.country_name,
 4rc.criteria_name,
 5ry.year,
 6ry.score
 7FROM university u
 8INNER JOIN country c ON u.country_id = c.id
 9INNER JOIN university_ranking_year ry ON ry.university_id = u.id
10INNER JOIN ranking_criteria rc ON ry.ranking_criteria_id = rc.id
11WHERE rc.criteria_name IN (
12'Total Times',
13'Total Shanghai',
14'Total CWUR'
15)
16AND ry.year = 2015
17ORDER BY ry.score DESC;
Results (top 20):
| university_name | country_name | criteria_name | year | score |
|---|---|---|---|---|
| Harvard University | United States of America | Total Shanghai | 2015 | 100 |
| Harvard University | United States of America | Total CWUR | 2015 | 100 |
| Stanford University | United States of America | Total CWUR | 2015 | 99 |
| Massachusetts Institute of Technology | United States of America | Total CWUR | 2015 | 98 |
| University of Cambridge | United Kingdom | Total CWUR | 2015 | 97 |
| Columbia University | United States of America | Total CWUR | 2015 | 96 |
| University of Oxford | United Kingdom | Total CWUR | 2015 | 96 |
| California Institute of Technology | United States of America | Total Times | 2015 | 94 |
| University of Oxford | United Kingdom | Total Times | 2015 | 93 |
| Harvard University | United States of America | Total Times | 2015 | 93 |
| Stanford University | United States of America | Total Times | 2015 | 93 |
| University of California, Berkeley | United States of America | Total CWUR | 2015 | 92 |
| Massachusetts Institute of Technology | United States of America | Total Times | 2015 | 92 |
| University of Cambridge | United Kingdom | Total Times | 2015 | 92 |
| University of Chicago | United States of America | Total CWUR | 2015 | 91 |
| Princeton University | United States of America | Total Times | 2015 | 91 |
| University of California, Berkeley | United States of America | Total Times | 2015 | 90 |
| Princeton University | United States of America | Total CWUR | 2015 | 89 |
| Yale University | United States of America | Total Times | 2015 | 88 |
| Imperial College London | United Kingdom | Total Times | 2015 | 88 |
There are all kinds of other queries you can write on this data.
Conclusion
So that's the sample database for university rankings. There's an ERD you can use to help you understand it or to design your own. You can also download the sample database tables and data to run your own queries on it.