How to Start an SQL Developer Debug Session
The debug feature of any IDE is an important and commonly used feature. Learn how to use the SQL Developer debug feature in this article.

How Do You Start an SQL Developer Debug Session?
First of all, you can only debug on PL/SQL code. Debugging normal SQL code is not possible, and wouldn't make sense, as the entire statement is executed at once. You can only debug in code that has multiple steps.
So, you'll need to identify which code you want to debug. You'll need a code object for this, such as a function or procedure.
I've created a procedure called TESTFIRSTNAME, which just runs a simple query and outputs the result to the console using DBMS_OUTPUT.
 1CREATE OR REPLACE PROCEDURE testFirstName
 2IS firstName VARCHAR2(20);
 3
 4BEGIN
 5   select first_name
 6   into firstName
 7   From student
 8   where student_id = 1;
 9
10   dbms_output.put_line(firstName);
11
12END;
So, what's the first step to debug this?
Step 1 - Compile for Debug
First, go to the object explorer and find your procedure or function.
Right click on it, and select Compile for Debug.
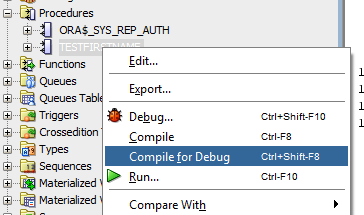
This will recompile the object and add in extra information for debugging purposes.
Note: You shouldn't do this on a production server, only on a development or test server. But then again, you shouldn't be debugging on production anyway!
Another way to do this is to open the object in the SQL Worksheet view, and select Compile for Debug.
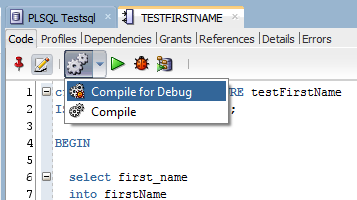
Step 2 - Set Breakpoints or Change Debug Action
Once it has compiled successfully, you need to set up your debug session.
If you start a debug now, the code will run and won't stop, unless it finds an error.
If you want it to stop, you can do it in two ways.
First, set a break point. A break point is a point in the code where the debugger will stop. It's useful for analysing the path that the code has taken, as well as seeing what variables are initialised and set to.
To set a breakpoint, click in the left margin of the code on the line you want to set a breakpoint on. If done correctly, a red dot will appear in the margin.
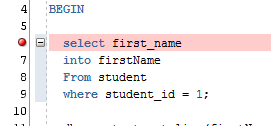
To turn off a breakpoint, click the red button again.
Or, you can use the keyboard shortcut of CTRL+SHIFT+F5 to toggle the breakpoint on the selected line.
If you don't want to set a breakpoint, you can just run the code and step through it. However, there is no button start the debug session by clicking Step Over, as found in other IDEs. SQL Developer's default "debug" action is to run until a breakpoint occurs.
You can change this by going to Tools > Preferences, and clicking Debugger.
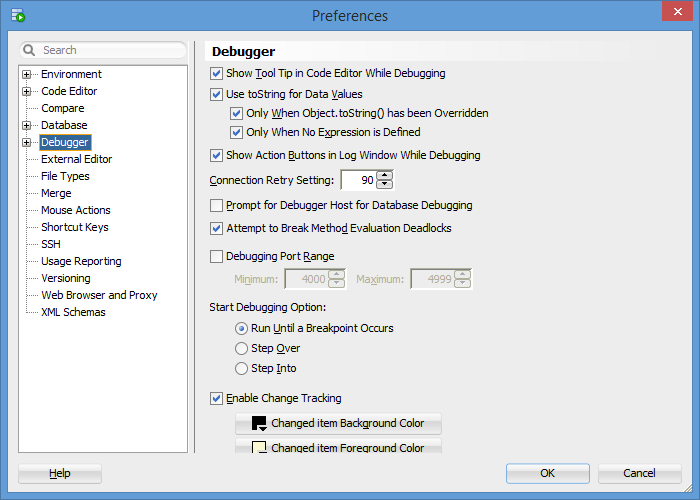
Change the option that says "Start Debugging Option" to Step Into. This will allow you to click Debug and run to the first line of code.
Click OK.
Step 3 - Connect to the Database
A commonly forgotten step is to connect to the database in your SQL Worksheet window. This is the drop-down on the top right. It may already be set to the right database, but if not, select the value you want.

Step 5 - Debug!
Now you've set up the environment and the code, you can start debugging
Click on the Debug button, which looks like a little ladybug.

Or, press CTRL+SHIFT+F10.
A window will appear:
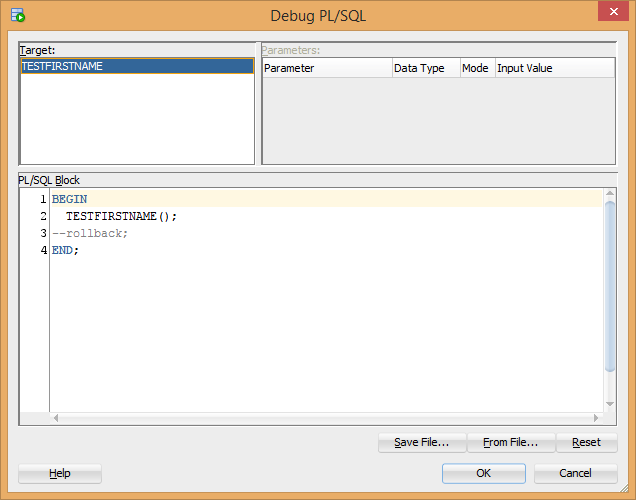
This window basically creates an anonymous PL/SQL block of code, to run the procedure you want to debug.
Why is this done? It's so you can set up any parameters or variables before you run the code, which is pretty useful in all of those complicated bugs you might deal with.
Change the code or add any parameters you like, and click OK.
If a firewall warning appears, you can click "Allow access".
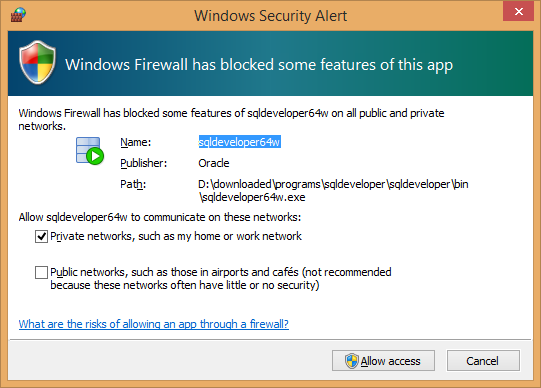
The debugger should now be running!
SQL Developer Debug Commands
There are several commands available in the SQL Developer debugger.

From left to right, starting with the big red square, they are:
- Stop - stops the debug session.
- Find Execution Point - moves your cursor to where the code has stopped.
- Step Over - steps over the selected line and moves to the next line in the code.
- Step Into - steps into the line of code selected, causing the debugger to continue inside the method or function that the line of code is currently on.
- Step Out - steps out of the method or function you are in, and returns to the level above.
- Step to End of Method - goes to the end of the method.
- Resume - continues debugging, until another error or breakpoint is reached.
- Pause - pauses the debugger in its place.
- Suspend All Breakpoints - turns off all breakpoints on the current database.
If you've used other debug tools before, then this concept may be familiar to you already.
Well, there's your explanation on how to set up an SQL Developer debug session. There are a few steps to take, but it's not that complicated once you've done it a couple of times!
