How To Use and Run The SQL Developer Execution Plan
One of the most valuable features for writing SQL queries is seeing how long it will take to run and how efficient it is. In SQL Developer, there's an option called "Explain Plan". Let's see how that works.

What Is An Execution Plan or Explain Plan?
An Execution Plan (sometimes called an Explain Plan) is a list of steps that the database will take to run your query and give you the results you need. It shows what kind of operations the database will perform, and some other statistics such as cardinality and cost (which we'll get into later).
As someone writing a query, it gives you an idea of how the query will run and shows you if a query is inefficient before you actually run it.
It also lets you analyse existing queries to see if they are inefficient if you're looking for ways to improve your queries. It's a common feature in many SQL IDEs as well.
How To See The SQL Developer Execution Plan
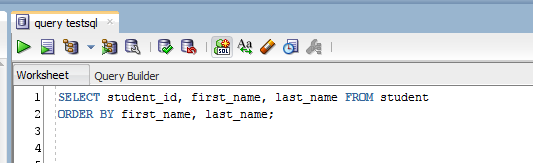
In SQL Developer, you can look at the Explain Plan (or Execution Plan) by going into the Worksheet window (where the SQL query is written).
Open your query there, or write the query you want to analyse.
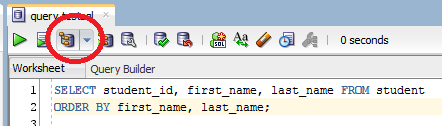
Now, click Explain Plan, or press F10.
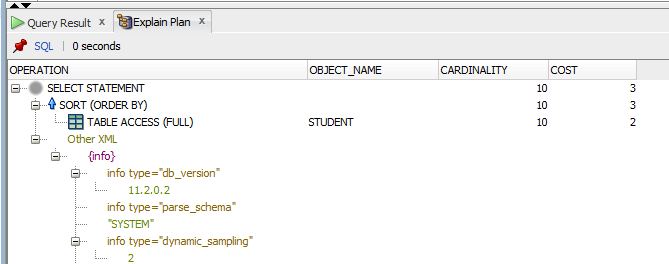
The execution plan is shown in SQL Developer.
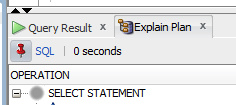
If you want to keep this execution plan, and not lose it when you run another Explain Plan, you can pin it to your window by clicking on the Pin icon.
Now, if you run another explain plan, you can compare them side by side. This is helpful if you make improvements to your query or have an alternative query that does the same thing.
While you're here, if you want a helpful list of ways to save time with Oracle SQL Developer, get my PDF guide here:
How To Read The SQL Developer Execution Plan
Reading an explain plan is easy, but it takes some time to learn what the information means.
As part of my university degree, I majored in Oracle databases, and one of our subjects was on performance. We had to analyse queries and write our own explain plans manually, and then run them against the database to see if they matched our manual work. It was pretty interesting. So, if you spend some time learning what all the lines mean, it can really help your query performance.
It's something that a database developer does often, especially when looking to improve their query's performance.
The SQL Developer execution plan is in a tree structure. The top of the tree is the main statement that is run.
As the tree goes down a level, it shows what the statement is made up of.
It's often easier to read the query from bottom to top.
So, in this example:
- A TABLE ACCESS (FULL) is performed, which gets the data from the table
- A SORT(ORDER BY) is performed because I sorted my data
- The SELECT statement is written.
I won't go into too much detail on what each of these options mean, because that can be covered in a separate post, but at a high level, that's what it does.
The Cardinality column explains the frequency of rows in the result set.
The Cost is a number that represents the time taken to run each step of the query. It is not a unit of measure such as minutes or seconds, it's an arbitrary number. The lower the cost, the quicker the query will run.
So, there's how you run an SQL Developer Execution Plan. In summary:
- Write or open your query
- Press Explain Plan or F10.
While you're here, if you want a helpful list of ways to save time with Oracle SQL Developer, get my PDF guide here: