Ultimate Guide to the SQL Execution Plan
If you've looked into SQL performance at all online, you've probably heard of something called an "SQL execution plan".
Or maybe you've heard it called a "query plan" or "explain plan".
What is it, why is it helpful, and what can you do with it?
You'll learn all about them, and more, in this guide.
Let's get into it!

What is an SQL Execution Plan?
An execution plan (or query plan) is the sequence of steps that the database plans to take to execute a query.
When you write an SQL query, you specify what you want to be done, such as the columns to see and the tables to get data from.
You're specifying the "what", and not the "how". In other programming languages, such as JavaScript, you specify how things are done, with variables and functions and loops.
With SQL, you specify the "what", and the database figures out the "how". You specify the tables you want the data from, and the database works out the most efficient way to give you this data.
The execution plan is the list of steps that the database takes to run that query.
An execution plan is commonly shown for a SELECT query, but they can also be prepared for other SQL queries such as INSERT, UPDATE, and DELETE.
What's the Difference Between an Execution Plan and an Explain Plan?
You might have heard the term "explain plan" before. What is it, and how is it different to an execution plan?
An execution plan is the sequence of steps that the database will take.
An explain plan is a feature in many IDEs to display the execution plan. Essentially, it's an SQL command, or a label on a button. The output is called an execution plan, so we'll be using that term in this guide.
Why Do You Need an Execution Plan?
Most articles, videos, and books about SQL performance and writing good SQL mention viewing the execution plan of a query as one of the first steps.
Why is that?
It's because it's a great way to see if there are any inefficient steps and areas to improve.
Just looking at the tables and columns and other clauses in the SQL statement is not enough to tell if the query will run efficiently.
The execution plan is the way to see this information.
The exact details depend on which database you're working on (which we'll go into detail later), but generally, you'll be able to see:
- The step that was taken
- The order in the overall process
- The cost of the step
- The reads and writes involved in the step
You can view the execution plan, and see all of this information, to help make a decision on how to improve your query.
So we know what an execution plan is, and why we need one. How can we see it?
The steps to see it, and what it looks like, is different in each database. Let's take a look at how to view the execution plan in Oracle, SQL Server, MySQL, and PostgreSQL.
Oracle Execution Plan
In Oracle, there are two ways to see the execution plan for a query:
- Click the button in your IDE (e.g. SQL Developer)
- Run an SQL command to generate and view it.
I'll show you both in this article.
Execution Plan in SQL Developer
Generating an execution plan in SQL Developer is quite easy. The process is similar in other IDEs, but SQL Developer is one of the most popular, so I'll explain the steps here.
To generate an execution plan, you need:
- A query you want to see the execution plan of
- A connection to the database
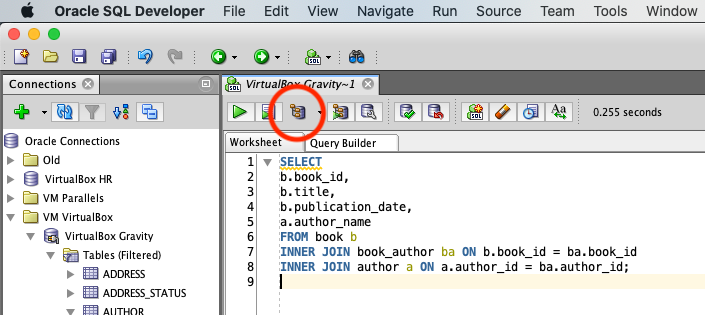
Once you have those, you simply click on the Explain Plan button on the toolbar, or press F10.
It's shown here:
Once you do this, a tab appears at the bottom of the window with your execution plan.
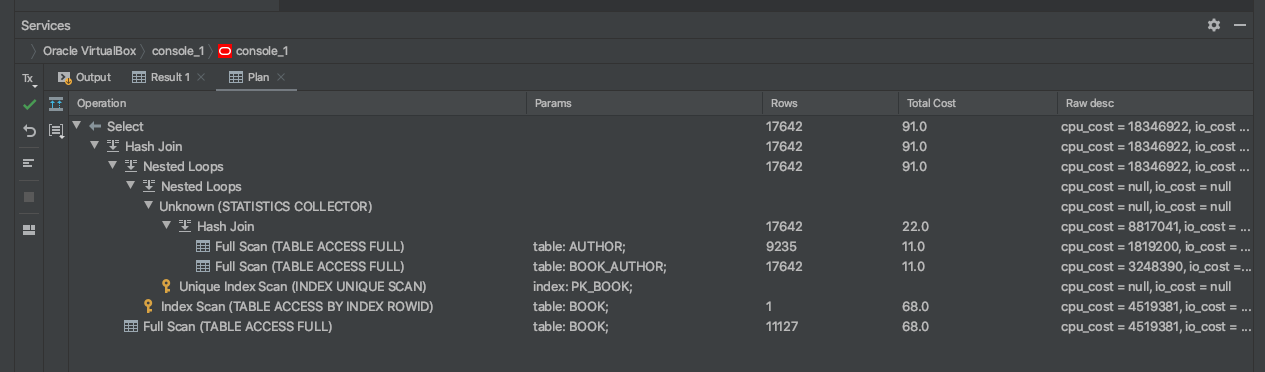
This is what the execution plan looks like in Oracle SQL Developer:
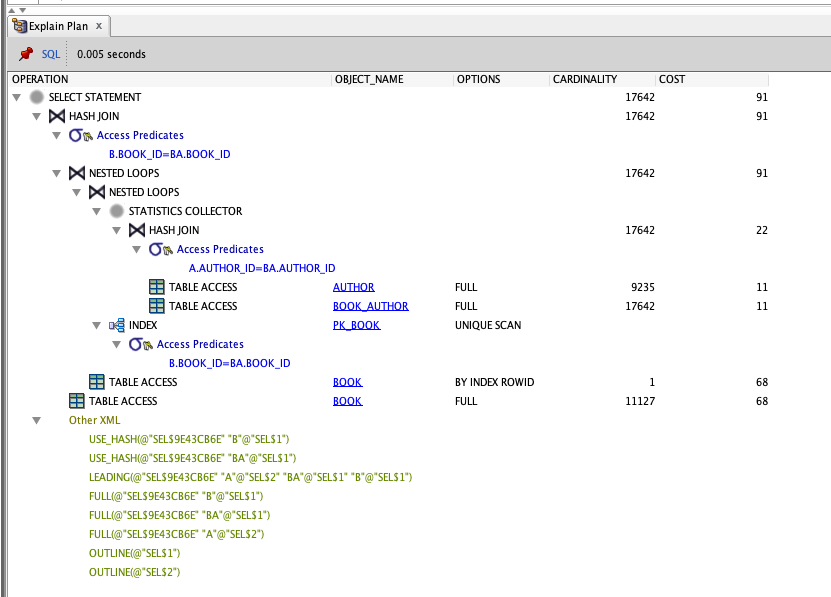
What does all of this mean?
We'll get into the details of the steps later, but here's what it's showing:
- Each step in the query is shown in a hierarchical layout.
- The steps in the query are run from the bottom of the hierarchy, or the most-indented row.
- Further steps are executed as you move up the hierarchy.
- We finish with a "Select Statement" which is the end of the query.
There are several columns shown here:
- Operation: the task that is performed, such as Hash Join or Nested Loops.
- Object Name: the name of the object (table, index) that is used in this step.
- Options: extra attributes for this step, such as the type of table access.
- Cardinality: the number of rows in this step.
- Cost: a number representing the cost of this step and all steps below it.
We'll take a look at how to view the execution plan in other ways, then see what this example is doing.
Execution Plan in DataGrip
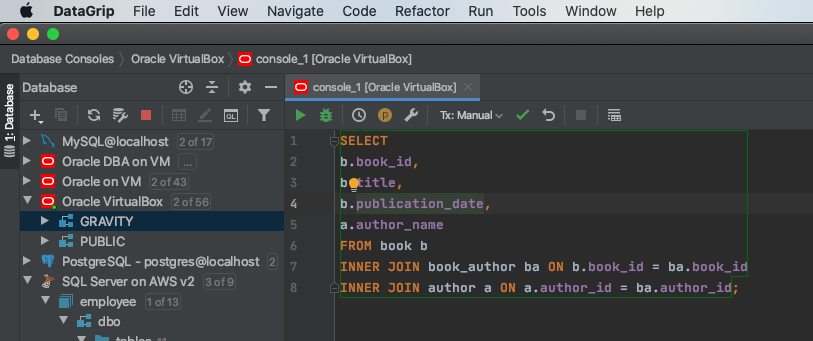
I've been using the DataGrip IDE by Jetbrains recently. Here's how you can generate an execution plan in DataGrip.
First, connect to your database and write or paste in your query.
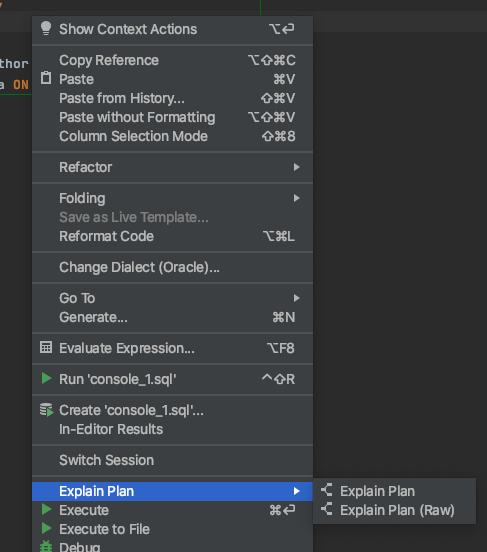
Right-click in your query, select Explain Plan > Explain Plan.
You'll see the execution plan in a tab at the bottom of the screen.
It looks similar to the SQL Developer execution plan, as you can see the operation, object name, rows, total cost, and a description.
I find this output a little more helpful, as the column names are more descriptive (e.g. Rows is more descriptive than Cardinality).
We'll see what these steps mean shortly.
Explain Plan SQL Command
The other way of seeing the execution plan in Oracle is by running a few SQL commands.
The IDEs make this process a little easier by clicking a button or using a menu, but if you don't have an IDE or want something more generic, you can use SQL.
So, how do you see an execution plan using SQL?
First, you put the keywords EXPLAIN PLAN FOR before your query.
Using our example, the query looks like this:
1EXPLAIN PLAN FOR SELECT
2b.book_id,
3b.title,
4b.publication_date,
5a.author_name
6FROM book b
7INNER JOIN book_author ba ON b.book_id = ba.book_id
8INNER JOIN author a ON a.author_id = ba.author_id;
Next, run this command. It will show an output of the word "Explained". It won't show the results of the SELECT query as the query is not run.
This EXPLAIN PLAN FOR keyword will generate an execution plan and populate a table in the Oracle database called plan_table. This is a global table accessible by all users.
Once you run this command, you can now view the plan_table. However, if you just select from the plan_table, the results won't make a lot of sense.
We can select from this table in a different way.
We can run this command to see the execution plan in a more readable form, using this built-in feature.
1SELECT *
2FROM TABLE(dbms_xplan.display);
The results of this query are:
 1Plan hash value: 3981032734
 2 -----------------------------------------------------------------------------------
 3| Id  | Operation           | Name        | Rows  | Bytes | Cost (%CPU)| Time     |
 4-----------------------------------------------------------------------------------
 5|   0 | SELECT STATEMENT    |             | 17642 |  1326K|    91   (2)| 00:00:01 |
 6|*  1 |  HASH JOIN          |             | 17642 |  1326K|    91   (2)| 00:00:01 |
 7|*  2 |   HASH JOIN         |             | 17642 |   465K|    22   (0)| 00:00:01 |
 8|   3 |    TABLE ACCESS FULL| AUTHOR      |  9235 |   171K|    11   (0)| 00:00:01 |
 9|   4 |    TABLE ACCESS FULL| BOOK_AUTHOR | 17642 |   137K|    11   (0)| 00:00:01 |
10|   5 |   TABLE ACCESS FULL | BOOK        | 11127 |   543K|    68   (0)| 00:00:01 |
11-----------------------------------------------------------------------------------
12Predicate Information (identified by operation id):
13---------------------------------------------------
14   1 - access("B"."BOOK_ID"="BA"."BOOK_ID")
15   2 - access("A"."AUTHOR_ID"="BA"."AUTHOR_ID")
16Note
17-----
18   - this is an adaptive plan
This shows the same plan as the IDE examples. It shows fewer rows, but it has more information about execution time and CPU cost.
So, that's how you generate an execution plan using SQL in Oracle.
To summarise, the steps are:
- Run EXPLAIN PLAN FOR your_query.
- Run Select * from table(dbms_xplan.display)
How to Read an Oracle Execution Plan
We've got the execution plan generated. How do we read it? How do we understand what's happening?
Let's take a look at the execution plan image from SQL Developer, as it has the most detail.
This is the same image, represented in text form. I've numbered the rows and indented them to make it easy to follow.
| No. | Operation, Object, Options | Cardinality | Cost |
|---|---|---|---|
| 1 | SELECT STATEMENT | 17642 | 91 |
| 2 | HASH JOIN | 17642 | 91 |
| 3 | NESTED LOOPS | 17642 | 91 |
| 4 | NESTED LOOPS | ||
| 5 | STATISTICS COLLECTOR | ||
| 6 | HASH JOIN | 17642 | 22 |
| 7 | TABLE ACCESS FULL, AUTHOR | 9235 | 11 |
| 8 | TABLE ACCESS FULL, BOOK_AUTHOR | 17642 | 11 |
| 9 | INDEX UNIQUE SCAN, PK_BOOK | ||
| 10 | TABLE ACCESS BY INDEX ROWID, BOOK | 1 | 68 |
| 11 | TABLE ACCESS FULL, BOOK | 11127 | 68 |
So, what's happening here?
Here's how this execution plan can be read:
- Step 7 is first, as it's the most indented row (step 8 is at the same level of indentation, but 7 appears first). This Table Access Full step is run on the Author table.
- Step 8 is next, which is a Table Access Full on the Book Author table.
- Step 6 is next. This is a Hash Join, which joins the data from the previous two Table Access Full steps. The details of this are shown in blue in the image, called Access Predicates. It shows that the tables are joined on a.author_id = b.author_id.
- Step 5 is then run. This is in the step called "statistics collector" which, well, collects statistics on the tables it's working on. It helps the execution plan determine the right steps as it gets the most up-to-date data on the tables.
- Step 9 is run. This is the Index Unique Scan. This means there is an index, called PK_BOOK. By the looks of the index name, it's the primary key on the book table.
- Step 4 is a Nested Loop, which means the database will iterate through the data it has so far and join it to the Index Unique Scan results.
- Step 10 is then run. It performs a Table Access by Index Rowid on the Book table. This is done because we did the Index Unique Scan earlier to get the primary key.
- Step 3 is another Nested Loop to join the data we have so far to the book table data.
- Step 11 is then run to get the rest of the book data.
- Step 2 is a Hash Join which is another method of joining two tables together.
- Step 1 is the final step which outputs the results to the screen.
These steps indicate how the query is run. Whenever you display the execution plan in Oracle (or any database), you'll get an output that lets you determine what's happening.
Terms in an Oracle Execution Plan
You've seen a range of terms in the execution plan. What do they all mean?
Table Access Full
Reads all rows and columns on the disk. Also known as a Full Table Scan. Usually the slowest operation and one to be avoided.
Table Access by Index Rowid
Reads a row from the table using a ROWID from a previously used index operation.
Index Unique Scan
This performs a traversal of a B-tree index, which is a common type of index. It's used when the search criteria will match no more than one entry (e.g. an index on the primary key).
Index Range Scan
This performs a traversal of a B-tree index and finds all matching entries. It is often used with indexes that have more than one value for the column.
Index Full Scan
This reads the entire index in the order of the index. Often used with an ORDER BY clause.
Index Fast Full Scan
This reads the entire index from the disk.
Hash Join
Joins two tables by creating a hash table.
Nested Loops
Joins two tables by getting the result from one table and matching it to the other table.
Merge Join
Joins two tables that have been sorted by matching rows together.
Sort Order By
Sorts the result of your query using the ORDER BY clause.
Sort Group By
Sorts the result of your query based on the GROUP BY clause, and aggregates data.
Hash Group By
Groups the results using a hash table.
Improvements to Look Out For
The execution plan is great because it tells you what operations are being performed when the query is run.
What should you look out for as areas of improvement?
Any "Table Access Full" steps in your plan should be avoided. Sometimes you can't do anything about it, but these are likely the slowest steps in your query. Try to avoid them by restructuring your query or adding indexes where appropriate.
If you don't need to sort or find unique rows, remove the Order By and Distinct clauses (if you have them). This can remove steps from the execution plan and speed up your query.
SQL Server Execution Plan
In SQL Server, you can generate an execution plan by either:
- using the IDE such as SQL Server Management Studio
- running an SQL command
Let's take a look at how to do these.
Execution Plan in SQL Server Management Studio
To see the execution plan in SQL Server Management Studio, you can either:
- Click on the Display Estimated Execution Plan button
- Press CTRL + L
- Right-click on the query and select Display Estimated Execution Plan
This will display the execution plan of your query.
The great thing about execution plans in SQL Server is that they are visual and have a lot of data.
See the section below on how to read them.
Execution Plan SQL Command
To see an execution plan in a text output, you can run the SHOWPLAN_TEXT command.
You can surround your query with this command and see your output.
 1SET SHOWPLAN_TEXT ON;
 2GO;
 3
 4SELECT
 5b.book_id,
 6b.title,
 7b.publication_date,
 8a.author_name
 9FROM book b
10INNER JOIN book_author ba ON b.book_id = ba.book_id
11INNER JOIN author a ON a.author_id = ba.author_id;
12
13GO;
14
15SET SHOWPLAN_TEXT OFF;
16GO;
You'll then see a text-based output of your execution query:
1  |--Hash Match(Inner Join, HASH:([a].[author_id])=([ba].[author_id]))
2       |--Clustered Index Scan(OBJECT:([gravity_books].[dbo].['author'].[pk_author] AS [a]))
3       |--Merge Join(Inner Join, MERGE:([b].[book_id])=([ba].[book_id]), RESIDUAL:([gravity_books].[dbo].[book_author].[book_id] as [ba].[book_id]=[gravity_books].[dbo].[book].[book_id] as [b].[book_id]))
4            |--Clustered Index Scan(OBJECT:([gravity_books].[dbo].[book].[pk_book] AS [b]), ORDERED FORWARD)
5            |--Clustered Index Scan(OBJECT:([gravity_books].[dbo].[book_author].[pk_bookauthor] AS [ba]), ORDERED FORWARD)
It doesn't show as much information as the visual version in SSMS, but it can help.
How to Read an SQL Server Execution Plan
You can read the execution plan from right to left. On the right, the process starts with more detailed steps, such as fetching data from tables and reading indexes.
As you move to the right, data is joined and other operations are performed based on your query.
You'll see the steps that are taken at each point, such as Clustered Index Scan, or Sort.
You can also see the cost of each step. Underneath each step is a Cost value, which shows a percentage. This is the percentage of the overall query that this step takes.
You can also hover over any of the steps in the execution plan to see more details about it, such as the number of rows, IO cost, and CPU cost.
Terms in an SQL Server Execution Plan
There are a few terms used in the SQL Server execution plans to be aware of:
Index Scan and Clustered Index Scan
This will read the entire index in order.
Index Seek and Clustered Index Seek
This will perform a B-tree traversal and find matching rows.
Key Lookup (Clustered)
This will find a single row from a clustered index. Similar to Oracle's Index Unique Scan.
RID Lookup
This will find a single row from a table. Similar to Oracle's Table Access by Index Rowid.
Table Scan
This will read all rows and columns in the table. Also called a Full Table Scan. It's an expensive operation.
Hash Match
Joins two tables by creating a hash table.
Nested Loops
Joins two tables by getting the result from one table and matching it to the other table.
Merge Join
Joins two tables that have been sorted by matching rows together.
Sort
Sorts the result of your query using the ORDER BY clause.
Improvements to Look Out For
SQL Server Management Studio often displays a suggested index at the top of the execution plan tab. This can help you identify what improvements can be made. It doesn't always provide the best improvement, but it's a good place to start.
Also, any step that performs a Table Scan should be avoided by either adding an index or updating the design of the query.
Take a look at the cost percentages of each step to see which steps are taking the most of the processing time.
MySQL Execution Plan
There are two ways to generate an execution plan in MySQL:
- Using an IDE, such as MySQL Workbench
- Using an SQL command
Execution Plan in MySQL Workbench
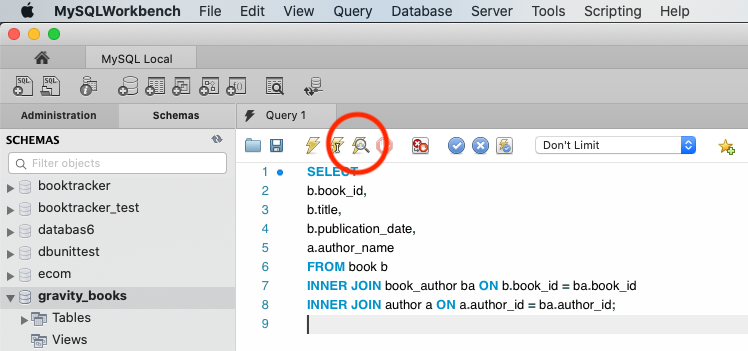
To show an execution plan for a query in MySQL Workbench, you'll need to connect to the database and have a query ready.
Once you've done this, click on the Explain Plan button on the toolbar, as shown here:
The Execution Plan will then be shown in a tab at the bottom of the window.
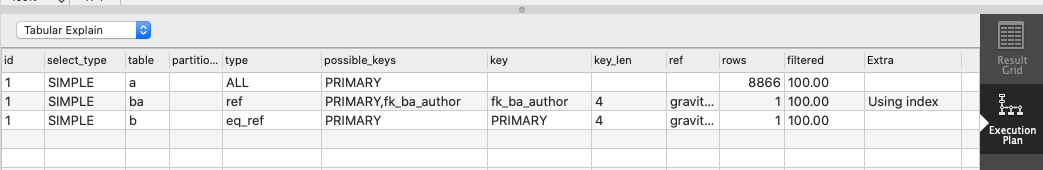
The plan is shown visually with boxes representing each step. You can change it to a tabular or text-based plan by selecting it in the drop-down on the list on the left.
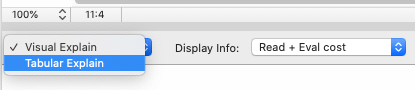
Here's the tabular plan.
Other IDEs have similar ways of generating an execution plan.
Execution Plan SQL Command
You can find the execution plan using an SQL command in MySQL.
Simply add the word EXPLAIN in front of the query and run it.
1EXPLAIN SELECT
2b.book_id,
3b.title,
4b.publication_date,
5a.author_name
6FROM book b
7INNER JOIN book_author ba ON b.book_id = ba.book_id
8INNER JOIN author a ON a.author_id = ba.author_id;
The output looks like the tabular execution plan in MySQL Workbench, and looks like this:
| id | select_type | table | partitions | type | possible_keys | key | key_len | ref | rows | filtered | Extra |
|---|---|---|---|---|---|---|---|---|---|---|---|
| 1 | SIMPLE | a | ALL | PRIMARY | 8866 | 100 | |||||
| 1 | SIMPLE | ba | ref | PRIMARY,fk_ba_author | fk_ba_author | 4 | gravity_books.a.author_id | 1 | 100 | Using index | |
| 1 | SIMPLE | b | eq_ref | PRIMARY | PRIMARY | 4 | gravity_books.ba.book_id | 1 | 100 |
It shows the steps involved in executing the query.
How to Read a MySQL Execution Plan
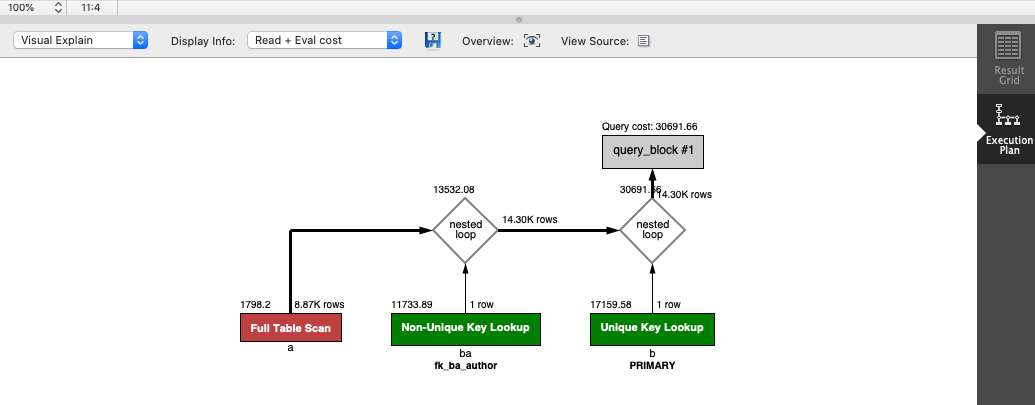
So how do you read a MySQL execution plan? Let's focus on the visual execution plan in MySQL Workbench, as it's the default view and easy to read.
We start at the bottom left of the tree. Each box represents a step in the process.
Inside the box is the operation that was taken. In this example, the red Full Table Scan on the bottom left is run first.
Above the box on the left is a number that represents the cost, which is an arbitrary number that represents how expensive this step is.
Above the box on the right is the number of rows in this step. In this example, there are 8.87K rows.
Below the box is the table name or the table alias used in this step. In this example, the Full Table Scan is performed on table "a". To see what table it is, you can refer to your SQL query, which shows it's the author table.
The next step performed is the green box to the right of that. We can tell because the red box has a line going to a diamond above it, which says "nested loop", and the other box feeding into that is the Non-Unique Key Lookup step. It's on the "ba" table, which is book_author. It also has the word "fk_ba_author" which is the name of the index used (which is the foreign key on the book_author table).
It then runs the Unique Key Lookup step and combines the results into the main output.
The reason some steps are red and some are green is that the red steps are those that are inefficient or have the highest cost. In this example, the Full Table Scan is the most inefficient, and the other two steps are OK.
Terms in a MySQL Execution Plan
Here's what each of the terms in a MySQL execution plan means. Each of them are related to a "type" value in the tabular execution plan:
Full Table Scan (type = ALL)
Reads all rows and columns in the table. This is the least efficient step.
Non-Unique Key Lookup (type = ref)
This operation traverses a B-tree index, similar to an Index Range Scan or a Table Access By Index Rowid.
Unique Key Lookup (type = eq_ref)
This performs a traversal of a B-tree to find one row, similar to an Index Unique Scan or a Table Access by Index Rowid.
Type = Index
This step reads the entire index in the index order. It's similar to an Index Full Scan.
Improvement to Look Out For
There are a couple of things to look out for when working with MySQL execution plans.
The first is any red boxes that appear in the plan. Sometimes they are unavoidable, but other times they can indicate a poorly designed query or a lack of indexes.
Another thing to look for is steps with a high cost. These may be green but could have a cost higher than other steps. See if you can reduce the cost.
PostgreSQL Execution Plan
To see an execution plan in PostgreSQL, we add an EXPLAIN command in front of the query we want to see the plan for. This will work in any IDE.
1EXPLAIN SELECT
2b.book_id,
3b.title,
4b.publication_date,
5a.author_name
6FROM book b
7INNER JOIN book_author ba ON b.book_id = ba.book_id
8INNER JOIN author a ON a.author_id = ba.author_id;
Here's the output:
1Hash Join  (cost=657.14..1005.23 rows=17642 width=59)
2  Hash Cond: (ba.author_id = a.author_id)
3  ->  Hash Join  (cost=391.36..693.11 rows=17642 width=48)
4        Hash Cond: (ba.book_id = b.book_id)
5        ->  Seq Scan on book_author ba  (cost=0.00..255.42 rows=17642 width=8)
6        ->  Hash  (cost=252.27..252.27 rows=11127 width=44)
7              ->  Seq Scan on book b  (cost=0.00..252.27 rows=11127 width=44)
8  ->  Hash  (cost=150.35..150.35 rows=9235 width=19)
9        ->  Seq Scan on author a  (cost=0.00..150.35 rows=9235 width=19)
The text or tabular output is shown, which includes the steps taken, objects, cost, and rows.
How to Read a PostgreSQL Execution Plan
To read an execution plan in PostgreSQL, you start at the row that is the most indented and work up from there.
Here's the execution plan above with row numbers added to help explain the order:
| Row | Operation |
|---|---|
| 1 | Hash Join (cost=657.14..1005.23 rows=17642 width=59) |
| 2 | Hash Cond: (ba.author_id = a.author_id) |
| 3 | -> Hash Join (cost=391.36..693.11 rows=17642 width=48) |
| 4 | Hash Cond: (ba.book_id = b.book_id) |
| 5 | -> Seq Scan on book_author ba (cost=0.00..255.42 rows=17642 width=8) |
| 6 | -> Hash (cost=252.27..252.27 rows=11127 width=44) |
| 7 | -> Seq Scan on book b (cost=0.00..252.27 rows=11127 width=44) |
| 8 | -> Hash (cost=150.35..150.35 rows=9235 width=19) |
| 9 | -> Seq Scan on author a (cost=0.00..150.35 rows=9235 width=19) |
The operations are run in this order:
- Step 7: This "Seq Scan" step looks up all rows in the book table.
- Step 5: This step looks up all records in the book_author table.
- Step 6: This step is then run to do a hash join on the records in the book_author table and the book table.
- Step 3: This step is run to join records based on the book_id (the field mentioned in Step 4)
- Step 4: This just details the columns that are used in the join
- Step 9: This step is run to get all records in the author table.
- Step 8: This Hash step is run to join the
- Step 1: This step joins the existing data from book and book_author to the author table.
- Step 2: This defines the columns used in step 1.
Terms in a PostgreSQL Execution Plan
We've seen some terms used in this execution plan. What do they mean?
Seq Scan
This operation reads all of the columns and rows of the table. It's equivalent to a Full Table Scan and is the most expensive operation.
Index Scan
This operation traverses a B-tree index and finds matching rows, then gets the data from the table. It's similar to an Index Range Scan and Table Access By Index Rowid.
Index Only Scan
This operation traverses a B-tree index and finds matching rows. There is no table access.
Bitmap Index Scan
This operation gets all records from the index and sorts them using a bitmap data structure.
Nested Loops
This operation joins two tables together by querying the second table using the value from the first.
Hash
This operation loads data from one table into a hash table which is used to join to a second table.
Merge Join
This operation combines two results that are sorted into a single result.
Sort
This operation will sort the data based on the specified column.
GroupAggregate
This operation aggregates data as mentioned in the GROUP BY clause.
HashAggregate
This operation will also aggregate data but uses a temporary hash table in memory.
Improvement to Look Out For
Because the plan is not visual like other databases, it can be hard to know what to look for.
However, you should look for any Seq Scan steps, as these are full table access steps and are the most expensive. They can indicate missing indexes or poor query design.
You should also look for any steps that have a high cost. These may be legitimate, or they may indicate something you can improve.
Conclusion
An execution plan is a great starting place for analysing the performance of your query and to find areas of improvement. They can be generated in any IDE for these databases, either by using a button in the IDE or by running an SQL command.
While the terminology and output may differ in between databases, the concepts are the same.